How AI-Powered Data Dashboards Help Businesses Make Faster Decisions & Increase Revenue
Every modern organization runs on data. Sales teams track pipelines, marketing teams monitor campaign performance, and finance departments analyze revenue forecasts.
Yet despite having access to vast amounts of information, many leaders still struggle with a simple challenge: turning data into fast, confident decisions.
Reports arrive late. Insights remain buried in spreadsheets. Teams spend more time gathering numbers than interpreting them.
This is where AI-Powered Data Dashboards are transforming the way companies operate.
Unlike traditional dashboards that merely display charts and graphs, AI-powered dashboards actively analyze data, detect patterns, and surface actionable insights in real time. They help leaders move from reactive reporting to proactive strategy.
In an increasingly competitive market, businesses that adopt AI-powered analytics gain a powerful advantage: they can see opportunities sooner and act on them faster.
The Hidden Cost of Slow Data
Businesses today collect data from dozens of sources. Customer interactions live inside CRM systems like Salesforce. Marketing teams track traffic and engagement through tools such as Google Analytics.
Finance teams rely on accounting platforms, while operations teams gather logistics and supply chain data.
But these systems often operate independently.
The result is a familiar problem across many organizations: data silos.
When information is scattered across departments, decision-making slows down. Leaders wait for reports. Teams debate conflicting numbers. Opportunities slip through the cracks.
Common challenges include:
-
Delayed reporting cycles that take days or weeks
-
Inconsistent data sources across departments
-
Limited forecasting capabilities
-
Manual analysis that consumes valuable time
AI-Powered Data Dashboards solve this problem by integrating data sources, analyzing patterns automatically, and presenting insights through intuitive visualizations.
Instead of waiting for reports, executives can see the health of their business in real time.
What Are AI-Powered Data Dashboards?
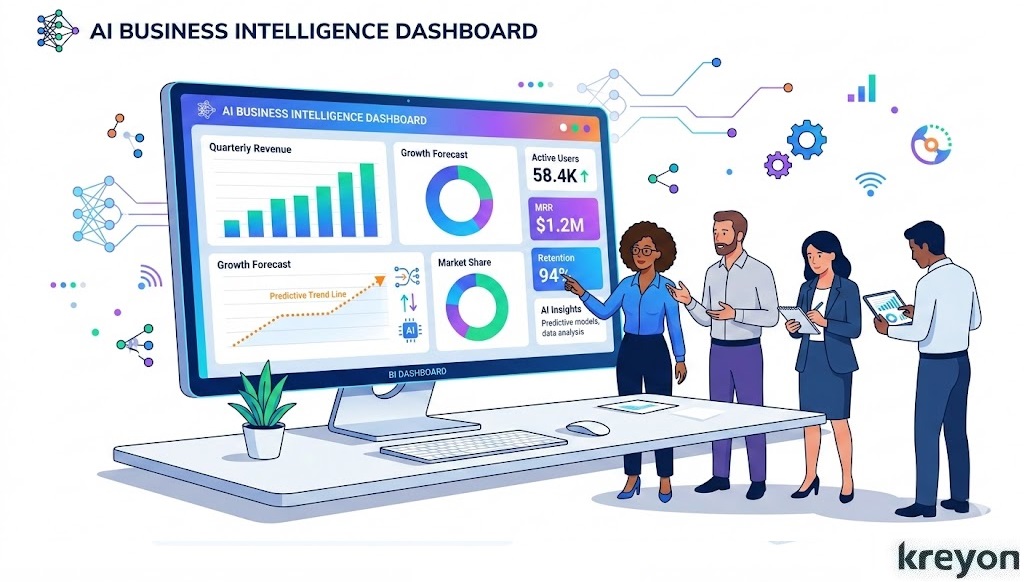
AI-Powered Data Dashboards combine advanced analytics, machine learning, and data visualization to provide a comprehensive view of business performance.
Traditional dashboards show historical metrics. AI dashboards go further, they analyze trends, identify anomalies, and predict future outcomes.
Modern analytics platforms like Power BI and Tableau now integrate artificial intelligence directly into their reporting capabilities.
Key capabilities of AI dashboards include:
-
Real-time data monitoring
-
Predictive forecasting
-
Automated anomaly detection
-
Natural language data queries
-
AI-generated insights and recommendations
Instead of searching through multiple reports, business leaders can ask simple questions such as:
“Which marketing channel is generating the highest ROI?”
or
“What factors are affecting our quarterly revenue forecast?”
The dashboard surfaces the answers instantly. Kreyon Systems implements a custom AI-powered data analytics dashboard designed to unify and analyze all critical business data.
This shift transforms dashboards from passive reporting tools into intelligent decision platforms.
Why AI-Powered Data Dashboards Enable Faster Business Decisions
Speed matters in business.
Markets shift quickly. Customer behavior evolves constantly. Competitors move fast to capture opportunities.
Traditional reporting systems often struggle to keep pace with these changes. By the time insights reach leadership teams, the opportunity may already be gone.
AI-Powered Data Dashboards compress the decision cycle by providing real-time visibility into key business metrics.
For example:
-
A sales leader can immediately detect a drop in conversion rates.
-
A marketing manager can adjust campaign budgets based on live performance data.
-
An operations manager can identify supply chain disruptions before they escalate.
Research from McKinsey & Company shows that organizations using advanced analytics and AI outperform competitors in profitability and operational efficiency.
The advantage often comes down to one factor: faster access to insights.
Key Metrics Every AI-Powered Data Dashboard Should Track
The effectiveness of an AI dashboard depends on tracking the right metrics. While every organization has unique priorities, several key indicators consistently drive strategic decisions.
Revenue Metrics
Revenue metrics provide a clear view of financial performance and growth potential.
Important metrics include:
-
Monthly Recurring Revenue (MRR)
-
Annual Recurring Revenue (ARR)
-
Revenue Growth Rate
-
Average Revenue Per Customer (ARPU)
AI dashboards analyze these metrics in real time, helping leaders identify trends and forecast future performance.
Sales Performance Metrics
Sales dashboards provide visibility into pipeline health and deal progression.
Key sales metrics include:
-
Sales Pipeline Value
-
Lead-to-Customer Conversion Rate
-
Average Deal Size
-
Sales Cycle Length
-
Win Rate
AI models can predict which deals are most likely to close, allowing sales teams to prioritize high-value opportunities.
Marketing Performance Metrics
Marketing leaders rely on dashboards to understand which campaigns generate the highest returns.
Essential marketing metrics include:
-
Customer Acquisition Cost (CAC)
-
Return on Advertising Spend (ROAS)
-
Conversion Rate
-
Website Traffic Sources
-
Customer Lifetime Value (CLV)
By combining these metrics with predictive analytics, AI dashboards help marketers allocate budgets more effectively.
Customer Experience Metrics
Customer insights are critical for long-term growth and retention.
Important customer metrics include:
-
Customer Retention Rate
-
Churn Rate
-
Net Promoter Score (NPS)
-
Customer Support Response Time
AI algorithms can detect early warning signs of churn, enabling companies to intervene before customers leave.
Operational Efficiency Metrics
Operations teams use dashboards to identify bottlenecks and improve productivity.
Key operational metrics include:
-
Inventory Turnover Rate
-
Supply Chain Lead Time
-
Order Fulfillment Speed
-
Operational Cost per Unit
AI-driven dashboards highlight inefficiencies and recommend process improvements.
How AI-Powered Data Dashboards Drive Revenue Growth
The ultimate goal of analytics is not just insight—it is business growth.
AI-Powered Data Dashboards help organizations increase revenue in several ways.
Improved Sales Forecasting
Predictive models analyze historical data to generate accurate revenue forecasts, helping companies plan resources and investments effectively.
Smarter Marketing Investments
AI dashboards reveal which channels produce the highest ROI, allowing marketers to focus budgets on strategies that deliver measurable results.
Personalized Customer Experiences
By analyzing customer behavior patterns, businesses can tailor recommendations, promotions, and communications to specific audience segments.
Better Operational Decisions
Operational insights help companies reduce costs, improve efficiency, and optimize supply chains.
Together, these improvements create a powerful multiplier effect on profitability.
Building a Successful AI Dashboard Strategy
Implementing AI-powered data dashboards is not just about visualization tools. It requires a structured strategy that combines data integration, AI modeling, and intuitive design to deliver meaningful business insights.
Organizations typically follow four key steps:
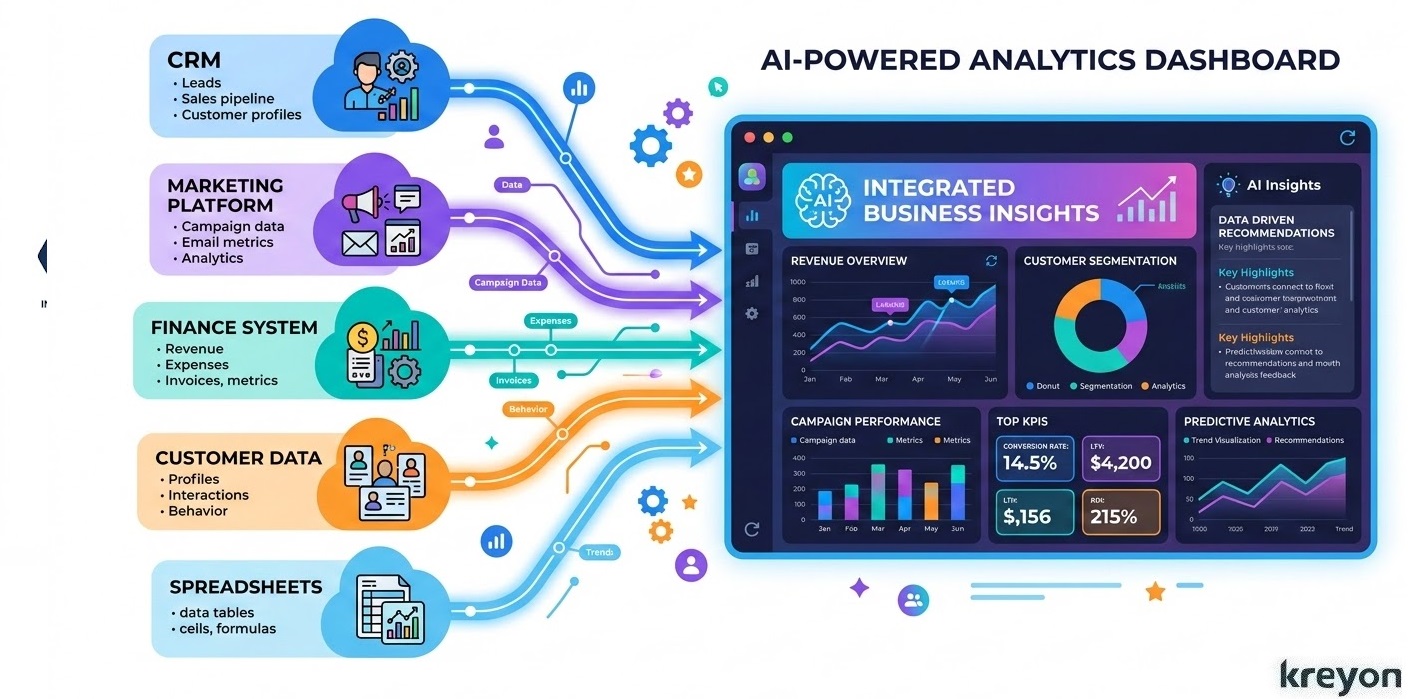
1. Integrate Data Sources
Businesses must connect data from CRM systems, marketing tools, finance platforms, and operational software.
The foundation of any effective AI dashboard is comprehensive data integration.
Modern businesses generate data across multiple systems such as:
-
CRM platforms
-
Marketing automation tools
-
Financial and accounting software
-
Product analytics platforms
-
Customer support systems
-
Operational databases
Without proper integration, data remains trapped in isolated silos, making it difficult to gain a unified view of the business.
A successful AI dashboard strategy begins by connecting these data sources through secure APIs and data pipelines. This allows organizations to consolidate information from across the enterprise into a single analytical environment.
2. Establish a Centralized Data Infrastructure
A data warehouse ensures consistency and accuracy across departments.
After integrating data sources, organizations must create a centralized data infrastructure to store and manage that information effectively.
This is typically achieved through a data warehouse or cloud-based analytics platform, where all incoming data is standardized, cleaned, and structured.
A centralized data environment offers several benefits:
Data Consistency
Departments operate using the same source of truth, eliminating conflicting reports.
Improved Data Quality
Automated processes can clean, validate, and standardize incoming data.
Scalability
As companies grow, their data infrastructure can easily accommodate new systems and larger datasets.
Faster Analytics
Centralized infrastructure enables faster query processing and real-time reporting.
For instance, when sales, marketing, and finance teams access the same centralized data warehouse, leadership gains complete visibility into business performance across departments.
This unified data architecture forms the backbone of any successful AI analytics ecosystem.
3. Apply Machine Learning Models
Once a strong data foundation is established, businesses can leverage machine learning and AI models to unlock deeper insights.
Traditional dashboards focus primarily on historical reporting. AI-powered dashboards go a step further by identifying patterns and predicting future outcomes.
Predictive algorithms identify trends, correlations, and anomalies.
Machine learning algorithms can analyze vast datasets to uncover insights such as:
Revenue Forecasting
Predicting future revenue based on historical sales trends and pipeline activity.
Customer Behavior Analysis
Understanding which customers are most likely to convert, upgrade, or churn.
Marketing Optimization
Identifying the most effective marketing channels and campaigns.
Anomaly Detection
Automatically detecting unusual patterns in business performance, such as sudden drops in conversion rates or unexpected cost increases.
These AI capabilities transform dashboards from passive reporting tools into proactive decision-making platforms.
Instead of simply answering the question “What happened?”, AI dashboards help businesses understand:
-
Why it happened
-
What is likely to happen next
-
What actions should be taken
This predictive intelligence allows organizations to make faster and more informed strategic decisions.
4. Design User-Friendly Dashboards
Clear visualizations help decision-makers quickly understand key insights.
When executed effectively, this strategy creates a scalable analytics ecosystem that supports long-term growth.
Effective dashboards focus on clarity, simplicity, and relevance. Instead of overwhelming users with dozens of charts, the interface should highlight key performance indicators and actionable insights.
Key design principles include:
Clear Data Visualization
Use charts, graphs, and visual indicators that make trends and patterns immediately recognizable.
Role-Based Dashboards
Different stakeholders require different insights.
For example:
-
Executives need high-level strategic KPIs
-
Sales teams require pipeline performance metrics
-
Marketing teams focus on campaign analytics
Customized dashboards ensure each user sees the most relevant insights for their role.
Real-Time Updates
Modern dashboards should provide live data updates, allowing teams to monitor performance as it happens.
Automated Alerts
AI dashboards can notify users when important thresholds are crossed, such as declining conversion rates or rising churn risk.
When dashboards are designed thoughtfully, decision-makers can interpret complex data within seconds rather than hours.
The Future of AI-Powered Business Intelligence
AI-powered analytics is evolving rapidly.
In the coming years, dashboards will likely become even more sophisticated, offering:
-
AI-generated strategic recommendations
-
Voice-enabled analytics queries
-
Automated business insights
-
Self-optimizing decision systems
Rather than simply displaying data, dashboards will increasingly act as digital advisors for executives and leadership teams.
Organizations that invest in these capabilities today will be better equipped to compete in a data-driven economy.
Conclusion: Turning Data Into a Competitive Advantage
Data has become one of the most valuable assets in modern business. But without the right tools, that data remains underutilized.
AI-Powered Data Dashboards bridge the gap between information and action.
By integrating data sources, applying intelligent analytics, and delivering real-time insights, these dashboards empower leaders to make faster, smarter decisions.
The result is not just better reporting, it is better strategy, improved efficiency, and stronger revenue growth.
For organizations seeking to thrive in an increasingly competitive marketplace, adopting AI-powered analytics is no longer optional. It is a strategic necessity.
Companies that transform their data into actionable intelligence today will be the ones shaping the markets of tomorrow.
At Kreyon Systems, we transform fragmented data from CRM, marketing, sales, finance, support, web, etc. into intelligent dashboards that drive faster decisions & measurable revenue growth.