Interactive Dashboards for Enterprise Solutions
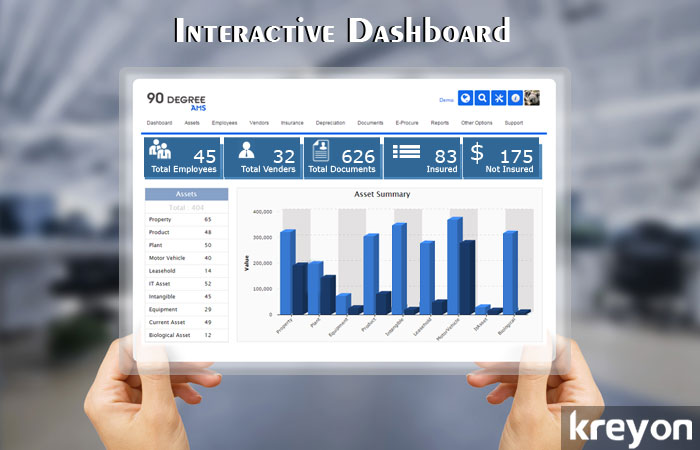
The number of variables that determine the performance of a business keep changing. Measuring different parameters that affect your organisation can be the difference between winning & losing. The information complexity has increased with the advent of digital avenues. Businesses find themselves in situations where they are struggling to deal with data. The interactive dashboards are meant to resolve this predicament by offering the “right information to review” rather than more information to review.
The interactive dashboards offer an insightful glance into the most critical information for a business. It reflects realtime status of how the organisation is progressing. It also tracks other parameters, which may become critical in future. These systems align the existing performance with insight, analysis and fine tune the way operations are managed. These dashboards are designed to increase clarity, measure performance metrics and most importantly analyse information to take proactive measures for the future. The following is an indicative list on how interactive dashboards can assist an organisation:
1. Drive with data:
Benchmark and measure what is important for your business. The dashboards can be configured with key performance indicators to reflect critical parameters for Sales, Customer Service, Finances, Products & Services, and Staff Performance etc.
2. Clarity:
A good dashboard is designed to solve the purpose of its users with crisp information. It highlights the important information and hides the unnecessary details. It is minimal, optimises information flow and allows executives to derive insights at a glance.
3. User Centric Information:
A configurable dashboard is designed to change itself based on the users. The type of users dictates the information details for the dashboards. For senior management, the dashboards are summarised in a nutshell with analytics, comparisons and overview. For other users, the information changes according to their roles. A sales person will be able to view his hot leads for follow-up, escalation manager will see unaddressed client queries and so on.
4. Configurable & Flexible:
The users can create and customise the dashboards according to their preferences. These dashboards provide ability to see, filter, share and use information for day to day activities. These configurable dashboards free up user’s time with easy search, improve collaboration and mobilise information.
5. Integration Options:
Organisations often run more than one IT system for their business operations. They may run softwares from different vendors to run say Sales, Finance, ERP and Field Service. With an integrated dashboard, it is possible to combine information from all these systems & display them in a single interface. This improves information flow and aids quick decision making.
6. Benchmark with Industry best practices:
These dashboards can be tailored as per industry best practices. For e.g. in Banking industry, they may be configured to highlight certain parameters like loan defaulters percent for past 5 years with comparative indexes. These parameters can be benchmarked against global industry standards to improve performance.
7. Automated Data collection:
The data collection efforts should be driven by automation to a large extent. The manual entry of data creates inefficiencies, inaccuracy, and doesn’t produce desired results. The data collection efforts can be automated with RF tags, embedded chips and other data import systems. Automated data collection can help in churning out accurate analysis of business performance with realtime information.
8. Visual Summary & Details:
A dashboard is meant to summarise performance indicators in a nutshell. The idea is to visually display all the relevant details for the users at a glance. However, the users may be required to drill down to the specific details of the parameters. The provision for detailed information should be available via dashboard.
9. Universal Access:
Cloud is driving most business applications these days. It makes computing easy, accessible and ubiquitous. Dashboards are created so that they are accessible irrespective of the device, platform or location. The dashboards are designed to be accessible on web-enabled mobile devices.
10. Standout Design:
A good dashboard design presents Information aesthetically to users. The performance indicators, correlations, trends, outliers and patterns are visualised with clarity. The data is interactive, provides visualisation with 2D, 3D charts and maps etc.
A good dashboard is one of the most pivotal elements for an enterprise solution. It is a great way to measure the progress, performance and also predict future trends for an organisation with advanced analytics. It saves time by making relevant information accessible in a click, improves collaboration, sharing and overall efficiency of business operations. A good dashboard provides insight into critical information, realtime review & actionable alerts for driving business.
Kreyon Systems is a leading business software company for HR software, ERP solutions and CRM development. If you need any assistance, please reach out to us.